Instructions
Overview
The Pandemic Simulator App is an Agent-Based Model designed to simulate the spread of an infectious disease within a single town/city. The App provides user control for basic disease parameters (i.e. infection rate, recovery time -- described below) along with control over the regions of the city itself. The user can choose to close and open certain parts of the city as the simulation progresses to view the effect of management decisions on disease spread and severity. The below sections contain more information on the different components of the App, and how to use them.
BETA NOTICE: This Application is still in Beta development and testing, and may contain bugs which hinder the user experience. The Application is also being consistently updated as additional features are developed. Please contact the developer at devchheda@madmobileapps.com with any feedback, suggestions, or questions.
Menu
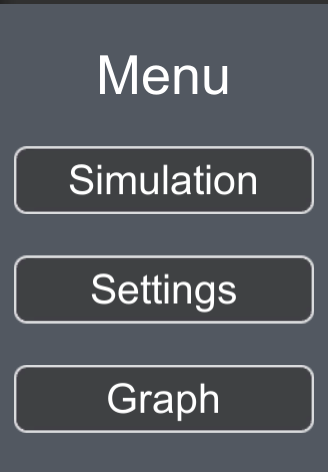
The menu is used to navigate between the different views of the App. There are three main views in the App:
- Simulation: Where the user can view the actual simulation in progress and can control which regions are open.
- Settings: Where the user can adjust certain Setup and Simuilation settings and variables.
- Graph: Where the user can view a graph of the population dynamics over the course of the simulation.
Each of these views is further expanded on below.
Simulation
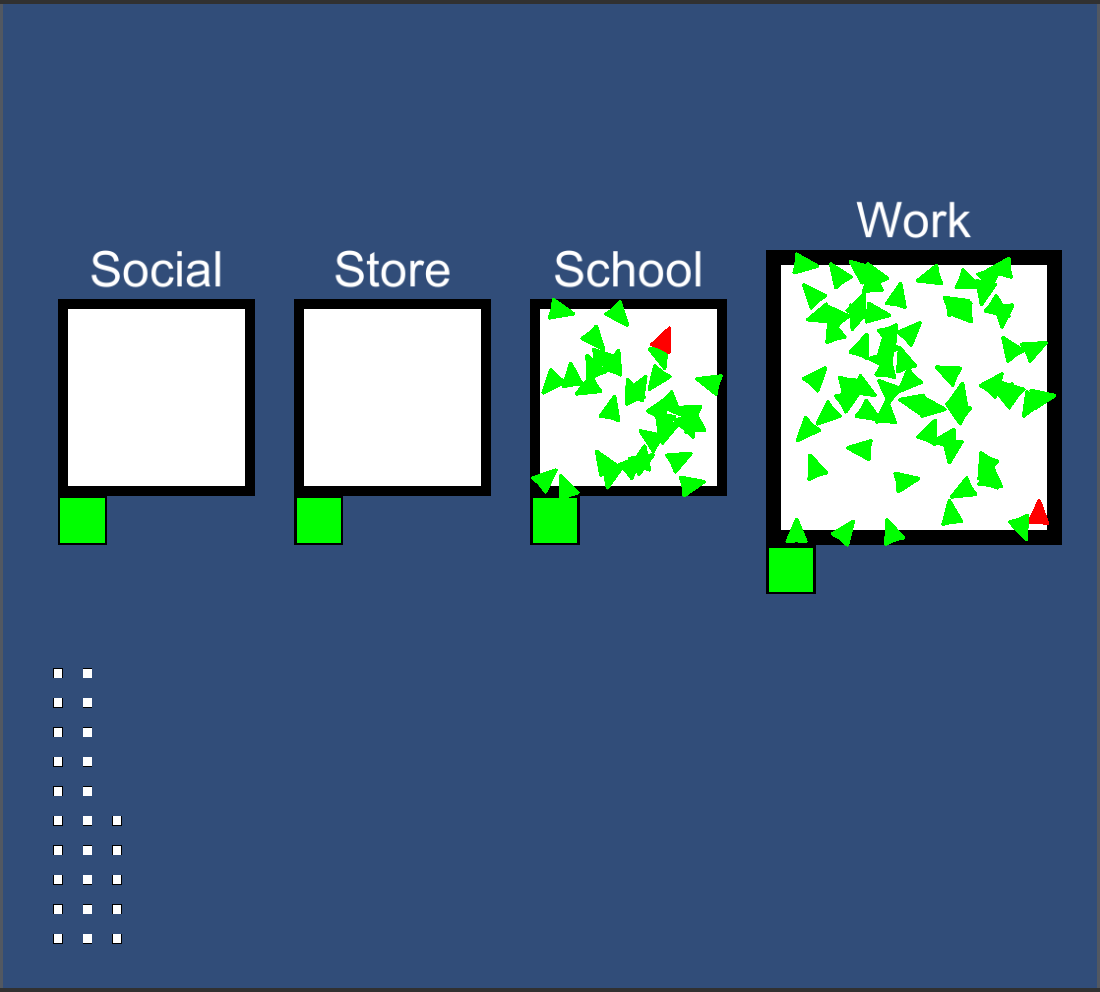
The simulation is an Agent-Based Model composed of two primary components: agents and regions. Agents (illustrated as arrows in the App) represent people which move around and can become infected. Regions (illustrated as squares in the App) represent spaces in which agents can move around.
In an Agent-Based Model, Agents move in discrete time steps according to a defined set of rules. In this App, Agents walk randomly around the Region they are in, and at every time step, may interact with nearby Agents. Each Agent has an infection state, which can take on one of three values: Susceptible, Infected, or Recovered. Susceptible individuals are those which have not yet been exposed to the disease, but can become Infected. Infected individuals are those which currently carry the disease and can infect Susceptibles. Recovered individuals are those which were previously Infected, but have now recovered from the disease, and can no longer be infected or infect others. At every time step, Infected Agents have a chance to infect every nearby Susceptible Agent. The probability of infecting a Susceptible Agent during an interaction is defined by the "Infection Rate" setting.
Regions can be classified into two types: Home Regions and Public Regions. Home Regions are those at the bottom of the simulation. Each agent is assigned to a Home Region, which they share with around 3 other people. The Home Region is the Region each agent returns to after Work or School and which the Agent stays at if the Region which they want to travel to is closed. Although Home Regions seem close to each other, they are sufficiently far apart such that an Agent in one Home Region cannot infect any Agent in another Home Region. The Public Regions are those which the Agents travel to either as part of a set routine (in the case of School and Work Regions) or randomly when they are at Home (in the case of Social and Store Regions). The Public Regions can be opened and closed by the user by clicking the green/red square in the bottom-left corner of the Region.
Controls
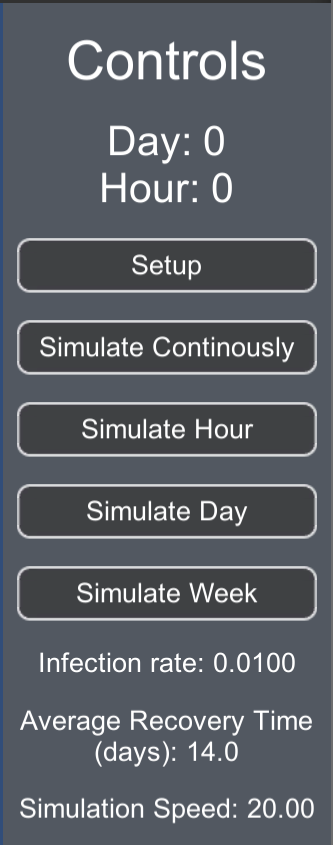
The Controls panel is used to control the simulation with various buttons:
- Setup: Used to restart the Simulation based on the defined settings.
- Simulate Continuously: Used to start running the simulation indefinitely. Pressing this button again will stop the simulation.
- Simulate Hour, Simulate Day, and Simulate Week: Used to run the model for the set amount of simulated time.
At the top of the Controls panel, the current simulated Day and Hour are displayed. At the bottom of the Controls panel, certain user settings (infection rate, recovery time, and simulation speed) are displayed for easy viewing. These settings can be adjusted through the Settings view.
Data

The Data panel is used to display particular data about the simulation. The first 3 rows simply show the number of Susceptible, Infected, and Recovered individuals. The next three rows display the more technical beta, gamma, and R nought values. To learn more about these values, what they represent, and how they are computed, go here. The values on the Data panel update at the end of each simulated day.
Settings
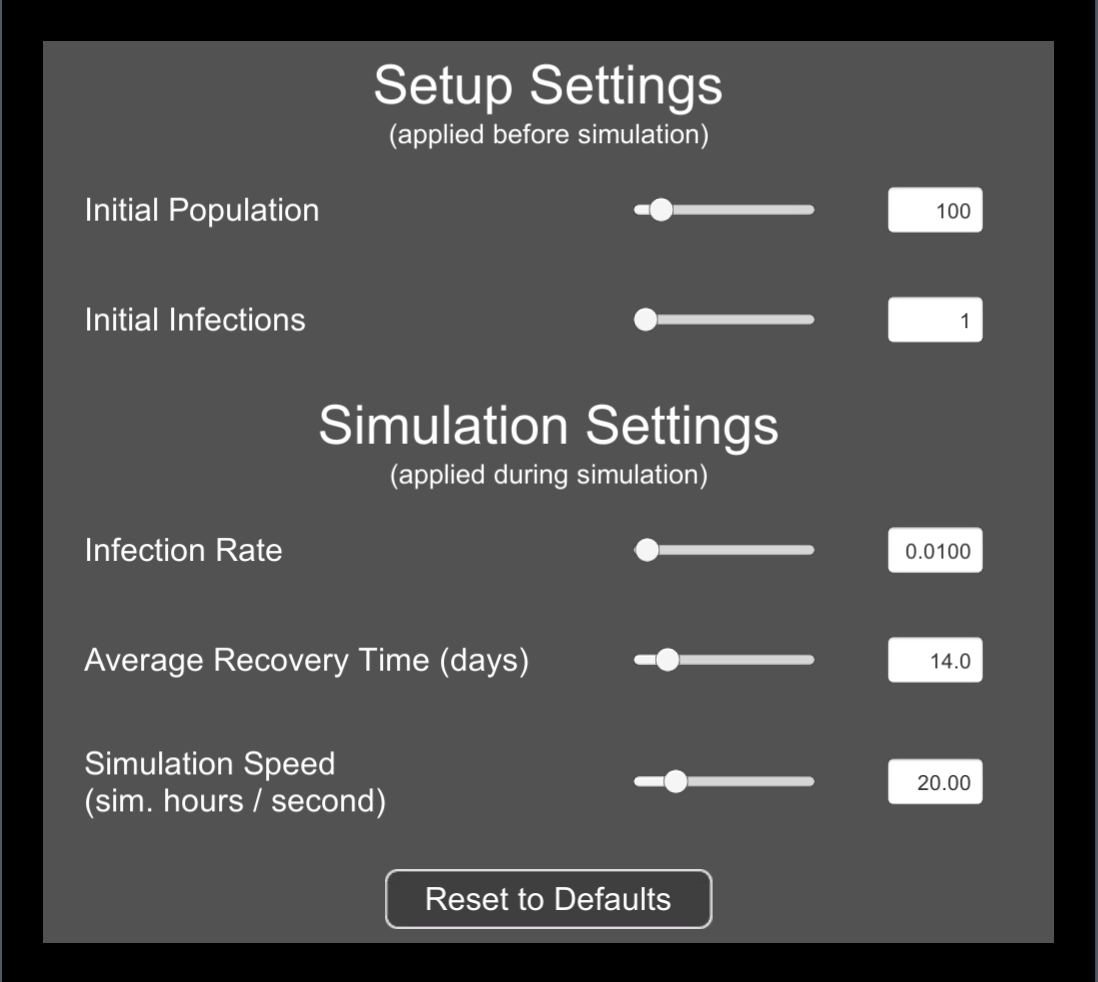
The Settings view is where the simulation variables can be adjusted. The first type of variables are those which are applied at the beginning of the simulation:
- Initial Population: Number of Agents in the model.
- Initial Infections: Number of Agents which are Infected at the beginning of the simulation.
The second type of variables are those which can be changed during the simulation:
- Infection Rate: Probability that an interaction between an Infected and Susceptible Agent will infect the Susceptible Agent.
- Average Recovery Time: Number of simulated days, on average, it takes for an Infected Agent to become Recovered.
- Simulation Speed: How fast the simulation runs, in simulated hours per second.
It should be noted that for the most realistic results, the Infection Rate and Average Recovery Time should not be modified during the simulation, but they can be if desired.
Graph
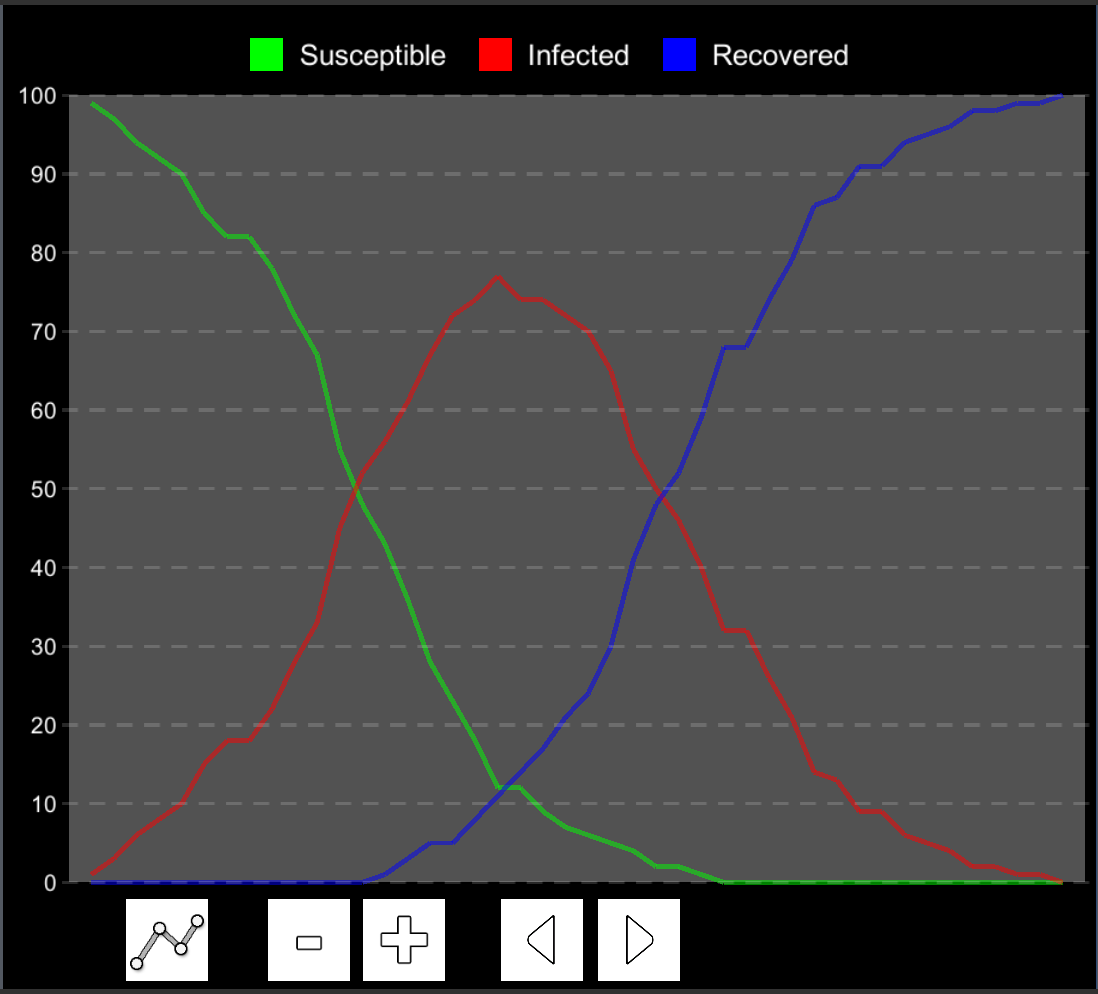
The Graph is used to visualize the changes in the number of Susceptible, Infected, and Recovered individuals over time. The number of Susceptible individuals is shown in green, the number of Infected individuals is shown in Red, and the number of Recovered individuals is shown in blue. The Graph contains many buttons at the bottom to control the Graph view. Listed from left to right:
- Dots: Toggles whether there are dots drawn for each point on each line graph. When dots are enabled, the user can hover over them to view the exact value of the graph.
- Zoom Out and Zoom In: Used to increase or decrease the portion of the graph which is visible.
- Shift Left and Shift Right: Used to shift the view of the graph to the left or right to view other parts of the graph.
Additionally, labels are present on the y-axis (measured in number of Agents), and a key of the line graphs is shown at the top.
You can read more about the technical aspects of the model by clicking the button above. If you have any other feedback, suggestions, or questions, you can contact the developer at devchheda@madmobileapps.com.